Measuring Floppy Drive rotation speed - Part 4
This is a continuation of Measuring Floppy Drive rotation speed and Measuring Floppy Drive rotation speed - Part 2 and Measuring Floppy Drive rotation speed - Part 3.
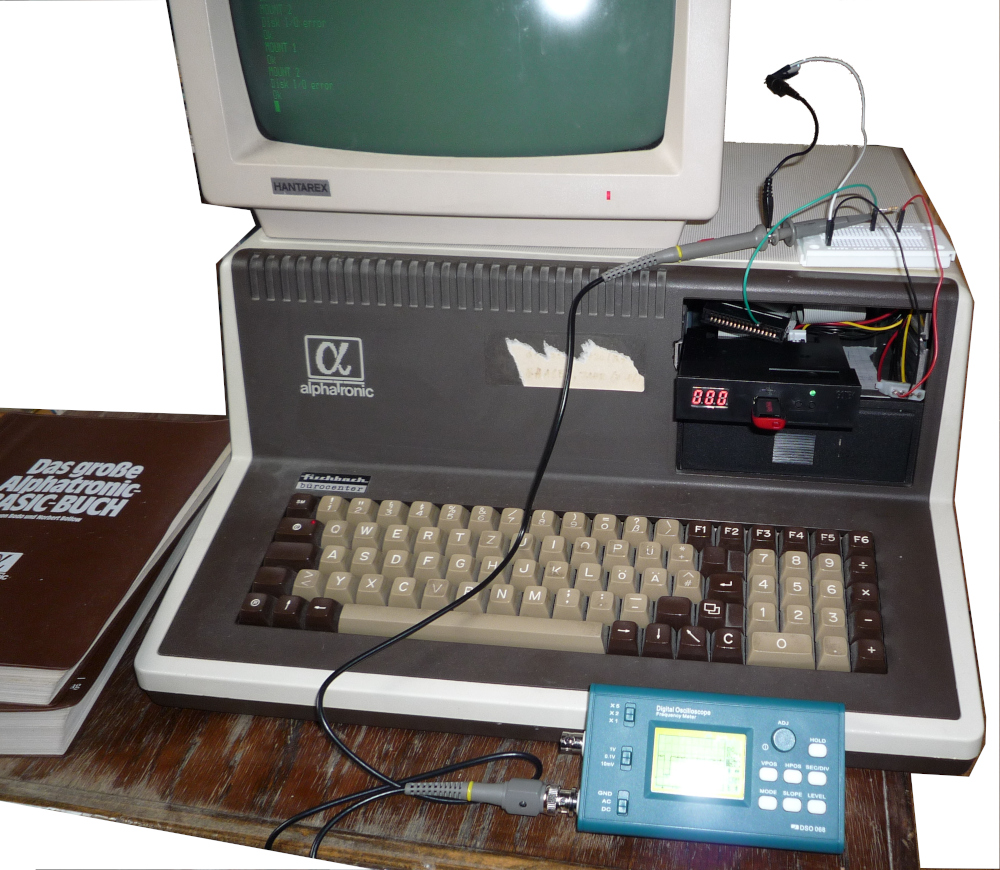
This part is about using a oscilloscope to measure the drive speed.
The principle is simple: We directly measure the index signal that the floppy drive provides. That way we know exactly, how fast the floppy spins.
I used my DIY DSO 068 for that. But there is a bit more to this digital storage oscilloscope: Since it is digital, it has also a interface and you can export the “raw” data for further analysis.
Therefore a short excursion to the DSO.
When you plug in the DSO 068 via USB, you’ll see also a virtual serial port. This port runs with the usual
settings 115200@8-N-1 (115200 baud, 8 data bits, no parity bit, 1 stop bit). The data transfer between your
computer (the “host”) and the dso happens with the help of the x-modem protocol.
To use that under a Debian linux system, you’ll need to install the package lrzsz.
This contains the command line tool rx. With that, you can transfer the current screen of the DSO as a bitmap
to the host and also the current recorded data as a csv (comma separated values) file.
To transfer the screen, first plug in the USB cable. Then configure the correct speed for the serial port, e.g.
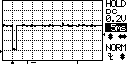
stty -F /dev/ttyUSB0 115200 (the device might vary). Then select in the DSO in the menu the option “send screen”.
After that, you can start the receiver via rx screen.bmp < /dev/ttyUSB0 > /dev/ttyUSB0.
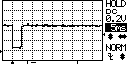
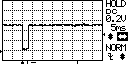
And the transfer begins. The result might look like this:
The same way is possible for the data: menu option “send wave data” and
rx wavedata.csv < /dev/ttyUSB0 > /dev/ttyUSB0.
The format of the file is described in Capture Uploading and Waveform File Format. All these documentations for the DSO 068 can be found on the main page DSO 068 Oscilloscope DIY Kit.
With the help of this documentation I could verify, that I measured at a sample rate of 2000Hz and I could calculate that actual voltage I measured: it was about 5 Volts, which is the expected value. Note, that the oscilloscope only displays a 10th of it - because I used the 10x-probe switch. Here’s an annotated excerpt of the CSV file, that has been created:
JYDZ,Waveform,,,DSO068,JYE Tech Ltd.,WWW.JYETECH.COM
14,10,10 # line 2, field 2: vertical display resolution=10
ChnNum,RecLen,ChnCfg,SampleRate,Resolution,Timebase,HPos ,TrigMode,TrigSlope,TrigLvl,TrigSrc,TrigPos,TrigSen,TBcopy
00001, 01024,       ,2000      ,00008     ,00019   ,00094,00001   ,00000    ,00145  ,       ,00010  ,       ,00019
00009
00000
65516
00001
2000   # sensitivity: line 9 = 2000 * 0.1mv / 10 (vertical display resolution) = 20mV
00009
00129  # reference: line 11 = 129 = 0V


---------------------------------------------------------------------------------------------
00155  # 155 - 129 = 26 -> 26 * 20mV = 520mV = 0.52V
00154  # 154 - 129 = 25 -> 25 * 20mV = 500mV = 0.5V
...
00132  # 132 - 129 = 3 -> 3 * 20mV = 60mV = 0.06V
00131  # 131 - 129 = 2 -> 2 * 20mV = 40mV = 0.04V
...
00154  # 154 - 129 = 25 -> 25 * 20mV = 500mV = 0.5V
00154  # 154 - 129 = 25 -> 25 * 20mV = 500mV = 0.5V
...
With the probe handle in “10X” position, this gives a measurement between 5.2V and 0.4 V.
Each line after the header corresponds to one sample. As the sample rate is 2000 Hz, each sample represents 0.5ms. If we count the lines between two falling edges, we get the time it took and can calculate the length of one index signal from the floppy drive. In this example, the first falling edge is at line 30, the next is at line 426. This gives us 426 - 30 = 396 samples or 198ms. Which is pretty close to the expected 200ms. So, this gives us already a hint, that the floppy drive is not too much off, because 198ms are 5.05Hz or 303 rpm… and not 388 rpm…
Instead of looking at the CSV files directly, we can also use GNU plot to draw nice plots. There are some details to consider, like how to load the csv file, skip the 16 header lines at the beginning and scale the y axis, so that we can read the real voltage values. Most of this is described in the gnuplot manual and on stackoverflow, e.g. scale measurement data.
I came up with this script for gnuplot:
set terminal png size 800,400
set output 'index-signal-alphatronic-2-laufwerk-floppy-signal_5ms.png'
set autoscale
set label "index (64)" at 64,0.1
set label "index (470)" at 470,0.1
set label "index (878)" at 878,0.1
plot 'index-signal-alphatronic-2-laufwerk-floppy-signal_5ms.csv' skip 16 using (($1-129)*0.2) with lines title "index signal floppy - sampling rate 2000Hz"
It skips the 16 header lines, scales the y axis (subtracts the 0V value 129 and multiplies with 0.2V to get the absolute voltage value) and adds some labels. I’ve looked up these numbers manually in the CSV file.
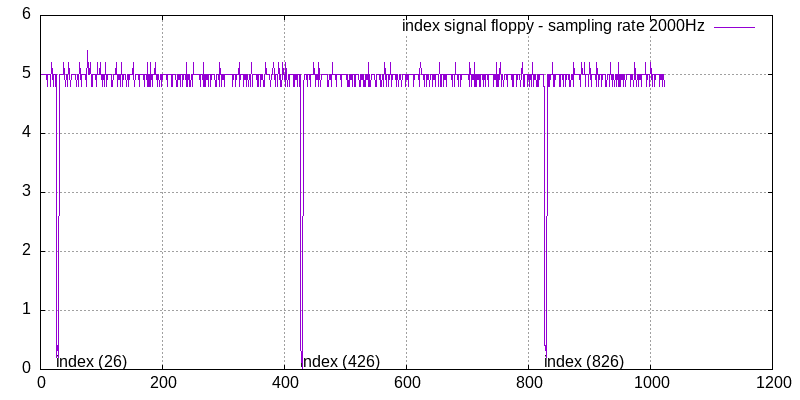
Ok, so now let’s have a look at the result:
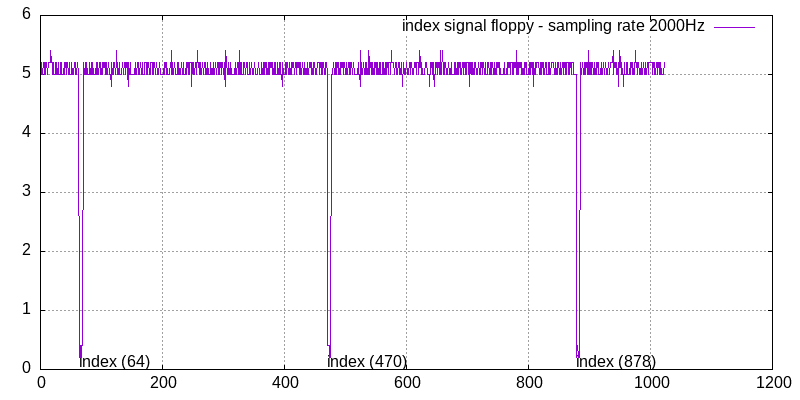
The CSV file is here: index-signal-alphatronic-2-laufwerk-floppy-signal_5ms.csv.
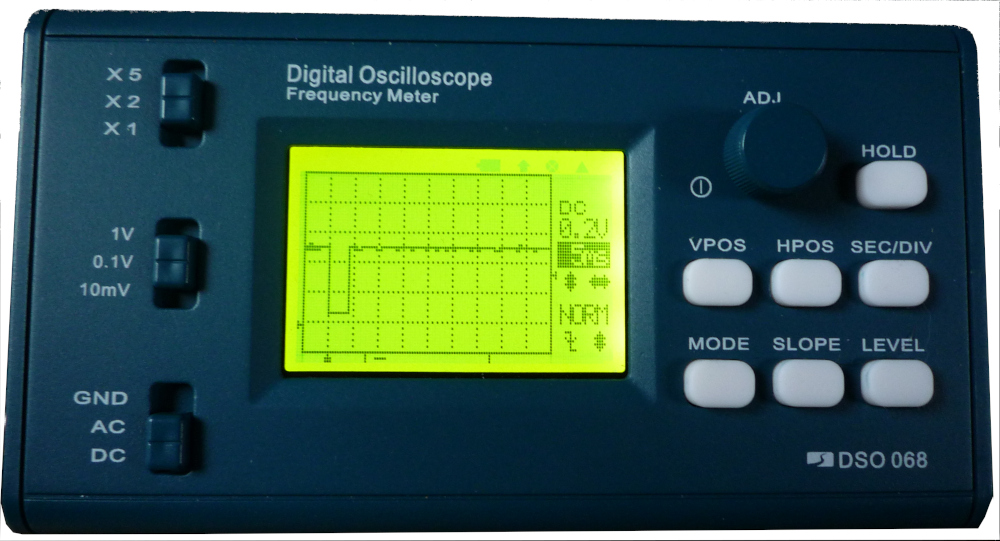
I measured the 2nd drive, directly via the floppy connector cable. I used the 5V and GND from the power connector. I also used a pull-up resistor (1kOhm). The green cable is the index signal (pin 8 on the floppy connector). I had this easy access to the connections and was able to measure the floppy drive while it is running in the Alphatronic because shortly before that, I managed to get the GoTek Floppy Emulator running as the first drive. Here’s how it looks:
So, we can see, that we recorded 3 index pulses (note, that you can configure the record length in the DSO). Between the first and second, 470-64=406 samples occurred, which is 203ms or 295 rpm. Between the second and third, 878-470=408 samples occurred, which is 204ms or 294 rpm.
Since I had the GoTek floppy drive emulator installed, I did the same measurement with that:
The CSV file is here: index-signal-gotek-floppy-signal_5ms.csv.
Here you can see, that it is pretty perfect at 200ms / 300rpm.
Conclusion: Nothing is wrong with the drives - at least not with the drive speed. It is correct at about 300 rpm. That means, that the measurement via the assembly code yields wrong results. Just to confirm that, I ran the same measurement with the GoTeK floppy emulator:
Ok
MOUNT 1
Ok
FILES
DISKRO.T2  2    DRIVER.OT  2    LAUFWE.RK  3    DSKCOP.Y   1
Ok
PRINT "GOTEK FLOPPY EMULATOR"
GOTEK FLOPPY EMULATOR
Ok
LOAD"DISKROT2"
Ok
RUN
In the last used drive a floppy has to be inserted!
How many measurements should be taken? 10
  Start measurement  0
    result: 0 -> 16218
  Start measurement  1
    result: 1 -> 16218
  Start measurement  2
    result: 2 -> 16218
  Start measurement  3
    result: 3 -> 16218
  Start measurement  4
    result: 4 -> 16217
  Start measurement  5
    result: 5 -> 16218
  Start measurement  6
    result: 6 -> 16218
  Start measurement  7
    result: 7 -> 16218
  Start measurement  8
    result: 8 -> 16217
  Start measurement  9
    result: 9 -> 16218
Data ready
  Minimum: .156765 s
  Maximum: .156774 s
     Mean: .156772 s
Rotations: 383 rpm
 Accuracy: 9.66669E-03 ms
Ok
MOUNT 2
Ok
PRINT "REAL FLOPPDY DRIVE"
REAL FLOPPY DRIVE
Ok
RUN
In the last used drive a floppy has to be inserted!
How many measurements should be taken? 10
  Start measurement  0
    result: 0 -> 16026
  Start measurement  1
    result: 1 -> 16042
  Start measurement  2
    result: 2 -> 15995
  Start measurement  3
    result: 3 -> 15989
  Start measurement  4
    result: 4 -> 16040
  Start measurement  5
    result: 5 -> 16035
  Start measurement  6
    result: 6 -> 15979
  Start measurement  7
    result: 7 -> 16036
  Start measurement  8
    result: 8 -> 16039
  Start measurement  9
    result: 9 -> 15980
Data ready
  Minimum: .154464 s
  Maximum: .155073 s
     Mean: .154823 s
Rotations: 388 rpm
 Accuracy: .609002 ms
Ok
The emulated drive allegedly spins with 383 rpm, the real floppy drive with 388rpm…
Comments
No comments yet.Leave a comment
Your email address will not be published. Required fields are marked *. All comments are held for moderation to avoid spam and abuse.